Doyen Walkthrough - Generating Reports
Reports for Doyen show a useful pie-chart style graph of all tasks you have used and the percentage of time you have spent on them. This allows the user to easily see breakdown of how they have been using their time.Reports
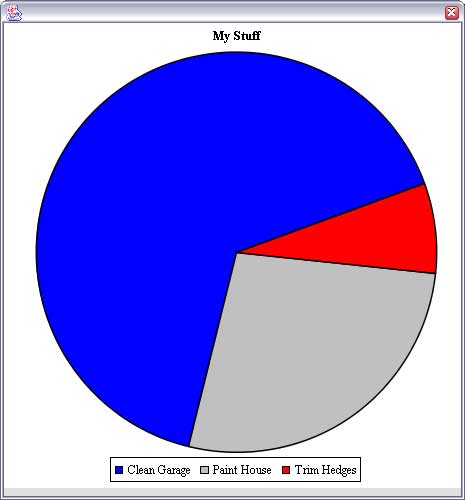
- To view your report, click View->View Usage Reports or push ctrl-r. The view should be something like the following:
- As you can see, I have spent a large majority of my time cleaning the garage, perhaps it is time I go trim some hedges or paint the house.
Home
- Release Notes
- FAQ
- Installation Guide
- Walkthrough
- Getting Started
- Managing Projects/Project Pane
- Event Pane
- Generating Reports